Love- Happiness or Sadness?- Insights from music
Posted on February 4, 2024 • 7 minutes • 1366 words
Love is a deep emotion of ecstacy and sometimes, pain. It is rather surprising that a single feeling can lead to two opposite emotions.
I see this as quite paradoxical. A feeling as magical as love not only rewards a person but can put the person in greater pain and yet this emotion is most beloved by humanity.
Emotion like love is time immemorial and is beyond gender, creed, caste, and even humankind. Humanity has been in love with the nature, the universe, and God. It is more surprising to see how a human could personify the supreme consciousness and love this entity more than anything comparable. The love they shower is so immense that poetry and songs flow out when they deeply think of God.
One such great person was Tyagaraja. In contrast to the general opinion of him being a great Carnatic singer, he was in fact a great lover. All he did was to enter into the bliss and his love instantaneously manifested into music. His disciples then took note of the lyrics, raaga, taala and other structures of his music and propagated them through time.
Interestingly, if one observes Tyagaraja’s works, one would find both happy moments and sad moments. Moments where he says “Can you please look at me at least from the corner of your eye”, “Please shun disregard”, “Why are you so stubborn? Will you not talk to me? And is it because I told you that you are stubborn?”. Many situations like these show his pining and worry. There are situations where he goes like “Looking at your face, one gets more and more happy”, “Your beauty squarely beats the beautiful moon”, “Oh the one who utters the nectar-dripping sweet words”, “You always come to me despite my overjoy of your memories”.
I realised what better way to understand what love brings, than understanding Tyagaraja’s compositions. Going through all the compositions and coming to a conclusion would take a lot of time. I came up with an alternate and indirect method to understand love. I looked at all the compositions of Tyagaraja and the raaga he composed them in.
Raagas are a blessing in the Indian classical music. The composed music follows a raaga system that has a said combination of notes or frequencies. If we look at the Natya Sastra, there are 72 major raagas belonging to 12 chakras. Each raaga has a strikingly different emotion and activates different mental and spiritual powerhouses of the body. From these main 72 Melakunta raagas are derived Janya raagas. In total, there can be an endless number of combinations. The currently categorized raagas are 1009 only in the Carnatic form of music. So in theory, one can understand the mood of the entire composition just by looking at the raaga.
To better understand love, I tried a scientific approach and categorised all the compositions of Tyagaraja based on the raaga used and thereby understand the feeling that is dominant in love. Is it the feeling where you are lost in the beauty and joy? Is it the pain that love gives you? What would a person in love actually engage himself more in?
This was an important question for me because I find people enjoy break-up songs or sad songs more. Does it mean happy songs are just a pastime between two sad songs?
Before revealing the answer, let me tell you how I got to the answer and see if you are convinced. I will also attach the code and dataset below if you want to have a look at the work.
So we all know it is the sound frequency that gives an emotion. The first thing I did was to divide notes into Neutral, Flat, Sharp, and Double Flat notes. Although Western music can be strictly confined to this, Indian classical music is a bit tricky. I then assigned these values to each raaga and its specific notes. Whie some raagas have alternate notes in some cases, I took the most used note and its pitch scale. Then, I calculated the pitch of each raaga; scores were weighted according to their occurence in all swaras. I found that most of the raagas carry a neutral pitch, but it is the few notes that add emotion to the composition.
Interestingly, some raagas have both sad and happy factors equally and if the composition has higher notes, it can make the whole piece sad or vice versa. For further analysis, I assumed an equal usage of all the notes in the composition and generated a sadness score. While Neutral notes do not add any value to the raaga’s sadness score, double flat takes up the context it is present in. A sharp note makes it happy and a flat note increases the sadness. Doing this, I did not find any great outliers of sadness or happiness. No raaga was too sad and none was too happy. Considering the complexity of Indian music and the usage of raagas for emotion, we cannot perceive this data as quantitative but only qualitative. So I took the median of the score and classified raagas as sad or happy.
One must remember that we do not just have happy or sad emotions. The Natya Sastra (music book of India) classifies emotions into 9 different types called navarasas. It might be possible for one to perform a comprehensive analysis on what combination of notes brings a said rasa or emotion. The complexity lies in the many possibilities of the use of these notes despite a raaga on average explaining a specific emotion. However, for my further curiosity, I broadly considered happy and sad emotions. And true to the general belief, I found raagas like Kalyani, Abheri, or Nattai being classified as happy and raagas like Vasanth Bhairavi and Thodi classified as Sad.
Now comes the interesting part. I then created a list of all the compositions of Tyagaraja with the raagas found on Wikipedia. Since raagas can have different names, spellings, and discrepancies, it was possible to have 84 different raagas from a possible 93 raagas Tyagaraja used in his compositions. A total of 210 compositions of tyagaraja are collected.
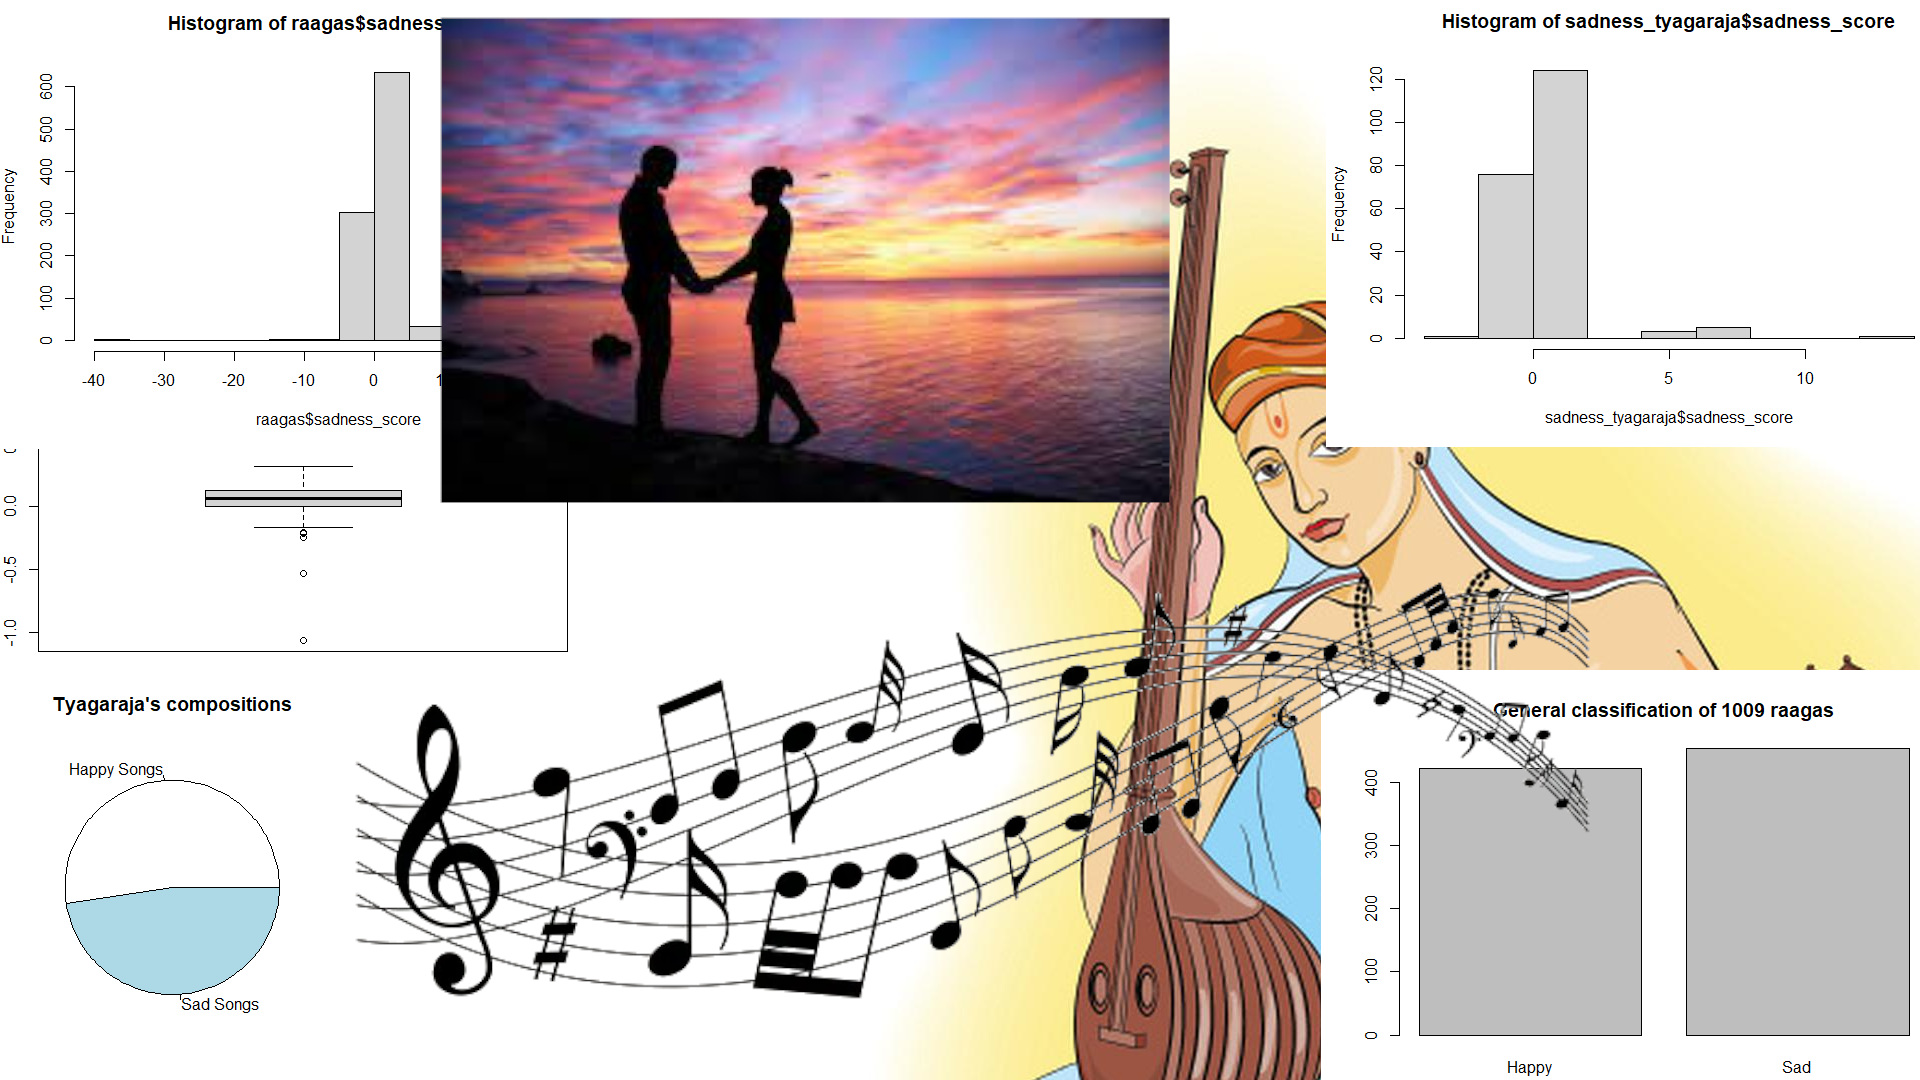
Now for the much-awaited result on the number of happy and sad raagas.
From the 210 composotions, an estimated total of 110 happy and 100 sad songs were composed by Tyagaraja.
While this is not what I expected, I realised a lover equally enjoys happiness and sadness. For, the only emotion in love is love alone. Happiness, joy, pining, or pain are just expressions of love. Everything in love or devotion is divine. With this small exercise I performed, I got closer to understand the true form of love. If you feel the same or would like to discuss more, reach out to me from the contact page.
PS: While Happy and Sad compositions were equally distributed in number, Tyagaraja seemed to have used raagas with many flat notes with a higher sadness score when looked at the distribution. Compositions like “kaluguna pada niraja seva” (Will it be possible for me to have the privilege of serving the lotus feet?), and “Eti janmamidhi haa o Raama” (What kind of life is this? Why did birth take place?) have higher sadness score than the number of compositions having such lesser sadness score.
R code for the above work:
rm(list=ls())
setwd("D:/Work/Blog_Files/posts_word")
#read the manually created raagas list
raagas<-read.csv("raagas.csv")
#load the libraries
library(stringr)
library(tidyverse)
#The scores are normalized to the number of notes belonging to a category
raagas<-raagas%>%mutate(avg_s_score=(str_count(average,"S")/3)*10)
raagas<-raagas%>%mutate(avg_f_score=(str_count(average,"F")/4)*10)
raagas<-raagas%>%mutate(avg_d_score=(str_count(average,"D")/2*10))
raagas<-raagas%>%mutate(avg_n_score=(str_count(average,"N")/7*10))
raagas[,6:9]%>%colSums()
write.csv(raagas,"raagas_working.csv")
#sadness_score=flatcounts-sharpcounts*(doubleflats+0.1/8)
#the idea being, there are many flat notes compared to sharp
#double flats take the context of raga and increase its intensity (adding psuedocounts)
#(assuming by 1/8 times: 2 occurances of these in 16 swaras)
raagas<-raagas%>%mutate(sadness_score=(avg_f_score-avg_s_score)*(avg_d_score+0.1)/8)
#removing extreme values for plotting
plotvalues<-raagas$sadness_score[raagas$sadness_score < 1.5&raagas$sadness_score > -1.5]
boxplot(plotvalues)
summary(raagas$sadness_score)
raagas<-raagas%>%mutate(happy_sad=
                          case_when(
  sadness_score<median(raagas$sadness_score) ~ 'Happy',
  sadness_score>median(raagas$sadness_score) ~ 'Sad'))
barplot(table(raagas$happy_sad), names=names(table(raagas$happy_sad)))
#read tyagaraja kritis list
tyagayya<-read.csv("tyagaraja.csv")
tyagayya<-tyagayya%>%distinct(composition_id, .keep_all=T)
nrow(tyagayya)
left_join(tyagayya, raagas)%>%group_by(happy_sad)%>%summarise(n=n())
#100, 91 for 191 songs. Total number of compositions by tyagaraja are: 210
#110 happy and 100 sad songs
pie(c(110,100), labels = c("Happy Songs", "Sad Songs"), main="Tyagaraja's compositions")
sadness_tyagaraja<-left_join(tyagayya, raagas)%>%select(sadness_score)%>%drop_na()
hist(sadness_tyagaraja$sadness_score)
plot(density(sadness_tyagaraja$sadness_score))
write.csv(left_join(tyagayya,raagas)%>%drop_na(), "tyagaraja_working.csv")
Doccuments: https://drive.google.com/file/d/1mjgjOqCoWTPUzp018vno6ysRgqFBvPjY/view?usp=sharing